
Our Process
Supply Chain & Logistics Strategy for Manufacturing
Supply Chain & Logistics Strategy for Manufacturing
Your supply chain and logistics decisions will shape your manufacturing costs, delivery performance, and risk profile for years. The location of each plant, warehouse, and distribution center is not just a real estate choice; it is a supply chain decision that affects every product that leaves your line.
A strong manufacturing supply chain strategy begins well before you evaluate specific buildings or industrial parks. Every location decision affects freight costs, lead times, working capital, and service levels across your entire network. Treat supply chain and logistics as an afterthought and you risk locking in structural costs that are difficult and expensive to fix later.
WorldPoint Site Selection helps manufacturers design supply chain and logistics strategies integrated with U.S. site selection and expansion, connecting where you operate with how your network moves, stores, and delivers product.
Supply Chain Strategy Consulting for Manufacturing Expansion
Most manufacturers do not need supply chain consulting continuously. They need it at specific decision points, when a choice is about to become expensive and permanent.
When to Bring in a Consultant
You are adding a facility and need to understand its effect on the whole network rather than its standalone economics
You are reshoring or nearshoring and rebuilding a supplier base and logistics footprint simultaneously
You are entering the U.S. market from abroad and lack the regional freight, labor, and utility knowledge to evaluate options
Your network has grown by accretion through acquisitions or incremental additions, and nobody has modeled the whole
You are comparing multiple states and need consistent criteria rather than competing pitches from economic development organizations
A location decision is imminent and the freight and inventory implications have not been quantified
Why Supply Chain and Site Selection Belong Together
These are frequently handled by different teams, sometimes by different firms, and often in sequence. That sequencing is the problem.
Site selection run first produces a location chosen on land, labor, and incentives, with supply chain consequences discovered afterward and absorbed as permanent operating cost. Network design run first produces a theoretical optimum in a location where you cannot get power, staff a second shift, or permit within your schedule.
Run together, each constrains the other productively. Network modeling identifies the regions that make sense for your flows; site evaluation determines which locations within those regions can actually be built and operated.
What WorldPoint Delivers
Network modeling that quantifies the freight, inventory, and service impact of each candidate location
Transportation analysis covering inbound, outbound, and interplant movement across all modes
Total landed cost comparison, integrating logistics with labor, utilities, real estate, and incentives
Supplier proximity and clustering analysis
Risk assessment across natural hazard, geopolitical, utility, and labor exposure
Shortlists and recommendations your leadership team can act on
Typical Projects
| Project Type | Core Question |
|---|---|
| New plant siting | Where does this facility belong given our existing network and demand? |
| Reshoring | What footprint replaces offshore production without raising landed cost? |
| Foreign direct investment | How does an international manufacturer enter U.S. markets efficiently? |
| Network redesign | Is our current plant and DC configuration still the right one? |
| Multi-state evaluation | Which of these regions actually performs best on total cost and risk? |
Why Manufacturers Partner with WorldPoint Site Selection
Manufacturing leaders often feel pressure to select a site quickly while also worrying about long-term costs, supply chain resilience, and future capacity. WorldPoint Site Selection is built for that reality.
We focus on U.S. manufacturing and industrial expansion, with particular strength helping international companies, including many from Asia, enter and scale in U.S. markets. You work with one coordinated team connecting supply chain strategy, logistics strategy, site selection, incentives, workforce analysis, and practical on-the-ground support.
We keep upfront client risk lower than traditional large-retainer consulting models and stay focused on clear, data-backed recommendations you can act on. Our goal is to replace uncertainty with clarity, so your next manufacturing site strengthens your supply chain rather than straining it.
Supply Chain Strategy vs. Logistics Strategy
These terms are frequently used interchangeably. They describe different scopes, and the distinction matters when deciding what to model and who to involve.
| Supply Chain Strategy | Logistics Strategy | |
|---|---|---|
| Scope | End-to-end, supplier to customer | Movement and storage |
| Covers | Suppliers, plants, distribution, inventory, risk, cost | Transportation, warehousing, freight, routing, delivery |
| Time horizon | Multi-year, structural | Annual to multi-year, operational |
| Typical decisions |
How many plants, where, what each produces, sourcing strategy | Which modes, which lanes, which carriers, which routing |
| Changed by | Capital investment and network redesign | Contracting, planning, and operational adjustment |
Supply chain strategy determines the structure: how many facilities you operate, where they sit, which suppliers feed them, how inventory is positioned across the network, and how much risk the configuration carries.
Logistics strategy determines how that structure is served: which transportation modes, which lanes, what warehousing, what routing, what service commitments.
How they work together. Supply chain strategy sets the constraints logistics operates within. A network with three plants and eight distribution centers creates a logistics problem; a network with one plant and two DCs creates a different one. No amount of logistics optimization overcomes a poorly structured network, and a well-structured network still underperforms if logistics execution is weak.
For manufacturers evaluating locations, this matters because site selection is a supply chain strategy decision with permanent logistics consequences. You are choosing the constraints your logistics team will work within for the life of the facility.
What Supply Chain & Logistics Strategy Means for Manufacturers
Supply chain logistics is the operational side of how materials, components, and finished goods move through your network. It includes transportation modes, routes, logistics infrastructure, inventory positioning, and day-to-day execution.
Manufacturing logistics focuses these decisions on production: inbound materials, work-in-process, and outbound finished goods.
Manufacturing supply chain strategy is broader still, linking supplier networks, production footprint, distribution strategy, transportation optimization, inventory strategy, and risk management into one coordinated plan.
A site that looks attractive on paper becomes expensive if it adds days of lead time, demands higher safety stock, introduces transportation bottlenecks, or depends on limited logistics infrastructure. WorldPoint helps you plan supply chain and logistics strategy alongside manufacturing expansion so each new facility strengthens the network.
The Flow You Are Actually Designing
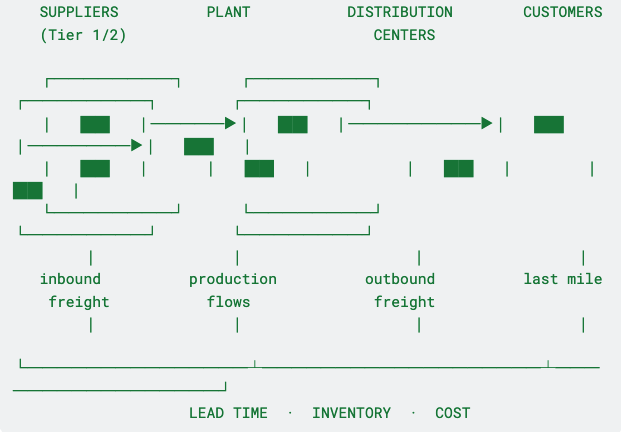
Every location decision moves one node on this diagram. The costs land across all of them.
How Site Selection Shapes Supply Chain Performance
The right location shortens lead times, reduces freight costs, and lowers risk. The wrong one increases inventory, ties up working capital, and exposes you to infrastructure constraints.
We evaluate how potential locations affect:
Supplier access and proximity to key Tier 1 and Tier 2 partners
Customer access, proximity to demand centers, and distribution strategy
Ports, rail, interstate, air cargo, and intermodal connectivity
Freight costs for inbound, outbound, and interplant movement
Access to regional hubs, distribution centers, and warehouse networks
Utilities and infrastructure supporting industrial logistics and manufacturing
Labor availability sustaining manufacturing and logistics roles long term
The WorldPoint Supply Chain Evaluation Framework
We assess every candidate location across six pillars. Applied consistently, they make otherwise incomparable options directly comparable, and they surface the tradeoffs that a single-factor comparison hides.
| Pillar | The question it answers |
|---|---|
| 1. Network Performance | How does this location change lead times, service levels, and inventory requirements across the whole network, not just at this facility? |
| 2. Transportation Access | What modes are genuinely available, at what cost and reliability, for our actual inbound and outbound flows? |
| 3. Labor Sustainability | Can this market staff the operation at launch and sustain it through growth, against existing and announced competition? |
| 4. Utility Reliability | Can utilities deliver the required capacity, quality, and redundancy on our timeline, with room to scale? |
| 5. Operating Cost Modeling | What is the total annual cost to run here, including freight and inventory carrying costs that site comparisons routinely omit? |
| 6. Expansion Capacity | Can this location absorb phase two and phase three without a second site and duplicated overhead? |
Two features make the framework useful rather than decorative.
Pillars are weighted to your project. A high-volume, low-value product weights transportation access heavily. A precision electronics operation weights utility reliability and labor sustainability. The same six pillars produce different conclusions for different manufacturers, because the thresholds within each come from your requirements.
Network Performance is evaluated first. Most site comparisons treat a facility as standalone and compare its costs against another facility's. That approach systematically misses the network effect, which is frequently larger than every other difference combined. A plant that costs more to operate can still lower total network cost by relocating volume closer to demand.
Core Components of a Manufacturing Supply Chain Strategy
Supplier network: Where Tier 1 and Tier 2 suppliers sit, how they cluster around facilities, and how proximity is balanced against risk diversification
Production network: How many plants, where, what each produces, and how the footprint serves regional and global demand
Distribution network: Number, size, and placement of DCs and warehouses, including regional hubs, cross-docks, and last-mile facilities
Transportation network: The mix of truck, rail, intermodal, ports, and air cargo; lane design; and freight cost structure
Inventory strategy: How raw materials, work-in-process, and finished goods are positioned to balance service, lead time, and working capital
Risk management: Natural disasters, geopolitical risk, tariffs, utility reliability, transportation disruption, and labor shortage across the network
Cost optimization: Continuous analysis across freight, inventory, facilities, and labor
These components must be designed together through structured network design rather than addressed individually.
Supply Chain Network Design
Network design determines the structure of your manufacturing, warehousing, and distribution system. A comprehensive optimization evaluates:
Current and future customer demand patterns
Service level commitments and lead time requirements
Plant locations, capacities, and product allocations
Distribution centers and regional hubs, including potential new sites
Transportation lanes, modes, and freight costs
Cross-border logistics for imports and exports
WorldPoint uses data-driven modeling to compare alternative footprints: a new U.S. plant versus expanding an existing one, warehouse consolidation versus regional fulfillment centers, adjusted plant-to-DC flows. Linking network design to site selection lets you evaluate locations on total network impact rather than individual facility metrics.
Transportation & Logistics Analysis
Even small changes in freight cost significantly affect total operating cost across a facility's life.
| Mode | Best For | Typical Tradeoff |
|---|---|---|
| Truckload | Time-sensitive, direct lane, full loads | Highest flexibility, highest cost per ton-mile |
| LTL | Smaller shipments, dispersed customers | Convenient, expensive per unit, more handling |
| Rail | Bulk, heavy, long-haul, non-urgent | Low cost per ton-mile, slower, requires spur or transload |
| Intermodal | Long-haul with truck flexibility at both ends | Cost between rail and truck, needs terminal access |
| Ocean | International, high volume, long lead time | Lowest cost, longest and least predictable transit |
| Air cargo | High-value, urgent, low weight | Fastest, highest cost, limited by cargo airport access |
Our transportation optimization work typically covers inbound freight for raw materials, outbound freight for finished goods and spares, interplant transfers, truckload and LTL and parcel, rail including unit trains and transload, intermodal, port access and ocean routing, air cargo, cross-border logistics between the U.S., Mexico, and Canada, and cost modeling across mode-shift and location scenarios.
Logistics Infrastructure That Shapes Location Value
Beyond highways and Class I rail, several categories of logistics infrastructure materially change a location's economics and are routinely overlooked in site comparisons.
Inland ports. Intermodal facilities functioning as inland extensions of coastal ports, with customs clearance and container handling away from the coast. Locating near one can capture much of a coastal port's benefit at lower land and labor cost.
Foreign Trade Zones. FTZ designation defers, reduces, or eliminates duties on imported components, and can lower duty on finished goods where the finished rate is below the component rate. For manufacturers importing significant input volume, FTZ status can be worth more than most incentive packages, and FTZ proximity or the ability to establish a subzone belongs in site evaluation.
Intermodal terminals. Rail-to-truck transfer capacity, and critically its service frequency. A terminal thirty miles away with daily service often outperforms one ten miles away with twice-weekly service.
Cargo airports. Airports with genuine freight capability, customs, and cold chain where relevant, distinct from passenger airports with incidental belly cargo.
Inland waterways. River and barge access for bulk commodities and oversize components. The lowest cost per ton-mile of any mode, and decisive for heavy or dimensionally large freight, though limited in geography and speed.
Supplier Location Analysis
Supplier location analysis aligns your supplier network with your manufacturing footprint. We evaluate Tier 1 and Tier 2 supplier locations and clusters, domestic versus international sourcing profiles, opportunities for supplier clustering near new sites, lead time reduction from proximity, inventory reduction potential from shorter and more reliable lanes, and risk diversification across geographies.
For manufacturers expanding or reshoring into the U.S., we analyze how new plants will interact with global suppliers, regional vendors, and potential new domestic partners. Supplier Location Analysis
Distribution Center & Warehouse Strategy
Warehouse location strategy and distribution center site selection are central to customer service and transportation cost. We help design distribution strategies considering customer service and delivery expectations, regional fulfillment and hub-and-spoke models, inventory positioning across plants and DCs and forward stocking locations, last-mile considerations, and integration with plants and suppliers.
Supply Chain Risk Assessment
Resilience is now a core requirement rather than a refinement. A comprehensive risk assessment evaluates how sites perform under stress, not only in base case.
We examine exposure to natural disasters, tariffs and trade policy and geopolitical risk, utility reliability and redundancy, labor shortages and long-term workforce trends, supplier concentration and single points of failure, transportation disruption across ports and rail and highways, and business continuity and alternative routing.
Total Landed Cost: Why the Cheaper Site Often Costs More
Site comparisons frequently stop at land, labor, and incentives. Those are the visible figures. Freight and inventory carrying costs are larger for most manufacturers and rarely appear in the initial comparison.
Illustrative annual comparison for a mid-size manufacturer:
| Cost Component | Site A | Site B |
|---|---|---|
| Land and building (annualized) | $1.2M | $1.6M |
| Labor | $8.4M | $7.9M |
| Utilities | $2.1M | $1.7M |
| Inbound freight | $3.6M | $2.4M |
| Outbound freight | $4.8M | $3.9M |
| Inventory carrying cost | $1.4M | $0.9M |
| Incentives (annualized) | –$0.8M | –$0.3M |
| Total annual cost | $20.7M | $18.1M |
Site A has cheaper real estate and an incentive package more than twice as large. Site B costs $2.6M less per year, almost entirely through freight and inventory, because it sits closer to both suppliers and demand.
Over a twenty-year facility life, that gap is larger than the entire construction budget. Figures are illustrative; the pattern is not.
Two Patterns We See Repeatedly
Distribution consolidation. An automotive supplier operating two distribution centers evaluated transportation lanes, supplier proximity, and labor markets across its service region. Consolidating into one strategically located facility reduced annual freight cost while maintaining service commitments, because both original locations had been chosen for reasons that no longer reflected where demand sat.
Capacity over incentives. A battery manufacturer compared a site offering the largest incentive package against one with stronger utility capacity and clearer upgrade timelines. Choosing utility capacity meant a smaller headline incentive and avoided a constraint that would have capped phase two expansion, a limitation that would have cost considerably more than the incentive difference.
Both patterns share a structure: the visible, quantified, immediately available number pointed one direction, and the total cost across the facility's life pointed the other.
Emerging Forces Reshaping Location Decisions
Several developments are changing what a strong manufacturing location looks like.
AI in supply chain planning. Demand forecasting, dynamic routing, and inventory optimization are improving materially, which changes how much buffer a network needs and therefore how it should be structured.
Digital twins. Virtual models of facilities and networks allow configurations to be tested before capital is committed, shifting more decision-making earlier in the process.
Scenario modeling. Single-point forecasts are giving way to evaluating locations across demand, cost, and disruption scenarios, with resilience under stress weighted alongside base-case efficiency.
Reshoring and nearshoring. Production returning to North America is rebuilding supplier ecosystems and shifting freight patterns, creating both opportunity and competition for sites, labor, and grid capacity.
Supply chain resilience. Redundancy has moved from cost line to strategic requirement, with dual sourcing and multi-modal transport options increasingly specified rather than optional.
Tariffs and trade policy. Duty exposure now materially affects sourcing and location economics, raising the value of FTZ designation and domestic supplier proximity.
ESG considerations. Customer and regulatory disclosure requirements make grid carbon intensity, water use, and freight emissions comparable across locations, turning them into site selection factors.
Energy availability and grid reliability. In many regions the binding constraint on new manufacturing is no longer land or labor but deliverable power, with data center development competing directly for the same capacity.
How Manufacturers Optimize Supply Chains During U.S. Expansion
Expansion driven by reshoring, nearshoring, or foreign direct investment creates an opportunity to redesign the network rather than simply add to it. WorldPoint helps manufacturers evaluate new facilities within a multi-plant optimization framework, balance regional footprints to serve North American customers, compare nearshoring and reshoring against continued offshore production using total landed cost, design logistics strategies that scale with growth, and plan for long-term scalability.
The WorldPoint Supply Chain Location Strategy Process
Business goals. Clarify cost targets, service requirements, growth objectives, and risk tolerance.
Supply chain assessment. Analyze your current network, freight costs, and performance.
Market analysis. Evaluate demand patterns, customer locations, and regional growth.
Logistics modeling. Build network models testing alternative footprints, warehouse locations, and distribution strategies.
Transportation analysis. Assess inbound, outbound, and interplant options, modes, and costs.
Cost modeling. Integrate transportation, labor, utilities, real estate, and incentives into total operating cost.
Risk analysis. Evaluate natural hazard, geopolitical, utility, and labor exposure.
Incentive analysis. Identify and quantify incentives supporting manufacturing and logistics investment.
Site selection. Shortlist and compare on supply chain performance, operating cost, and feasibility. Industrial Site Readiness · Manufacturing Feasibility Studies
Final recommendations. Deliver data-backed recommendations connecting supply chain strategy, logistics infrastructure, and location decisions.
Steps four through six iterate. Cost modeling frequently reveals assumptions worth revisiting in the network model.
Frequently Asked Questions
What is the difference between supply chain strategy and logistics strategy?
Supply chain strategy is end-to-end and structural, covering suppliers, plants, distribution, inventory, risk, and cost. Logistics strategy covers movement and storage: transportation, warehousing, freight, routing, and delivery. Supply chain strategy sets the structure; logistics strategy determines how that structure is served.
What is supply chain logistics?
The processes, assets, and decisions that move materials and finished goods from suppliers through plants and distribution centers to customers, including transportation modes, routes, warehousing, and inventory positioning.
What is the total landed cost?
The complete cost of delivering a product to its destination: production cost plus inbound and outbound freight, duties and tariffs, inventory carrying cost, insurance, handling, and applicable taxes. It is the correct basis for comparing sourcing and location options, because a lower unit cost frequently disappears once freight and duty are included.
What is supply chain network optimization?
The analytical process of determining the optimal number, size, and location of plants, warehouses, and distribution centers, and the flows between them, to meet service requirements at minimum total cost.
What makes a good manufacturing location?
One that fits your specific requirements. Generally: reliable utilities with capacity to grow, a sustainable labor market, efficient access to suppliers and customers, adequate transportation infrastructure, manageable risk exposure, and room to expand. The right weighting among these depends on what you make and how you distribute it.
How do supply chains influence manufacturing costs?
Through freight on inbound materials and outbound goods, inventory and working capital tied up in the network, expediting costs when lanes underperform, and the safety stock required to buffer unreliable supply. These frequently exceed the labor and real estate differences that dominate site comparisons.
How do manufacturers reduce logistics costs?
By optimizing plant and warehouse locations relative to suppliers and demand, consolidating shipments, shifting modes where service permits, improving routing, and negotiating carrier contracts from better data. Location decisions set the ceiling on what the other levers can achieve.
What is inbound vs. outbound logistics?
Inbound covers movement of raw materials and components from suppliers into your facility. Outbound covers movement of finished goods to distribution centers and customers. They often favor different locations, and the balance between them is a core input to site selection.
What is supply chain resilience?
The ability to maintain operations through disruption: natural disaster, supplier failure, transportation interruption, labor action, or geopolitical change. Built through supplier diversification, multi-modal transportation options, strategic inventory positioning, and location choices that avoid concentrated exposure.
How do companies redesign supply chains?
By modeling the current network to establish a baseline, defining future demand and service requirements, generating alternative configurations, evaluating each on total cost and service and risk, and phasing implementation. Redesign is usually triggered by expansion, acquisition, demand shift, or disruption.
What factors should manufacturers evaluate before expanding?
Supplier access, customer proximity, transportation infrastructure, labor availability and sustainability, utility capacity and reliability, incentives, real estate, permitting timelines, and supply chain risk, all assessed against your specific production requirements.
What is supply chain location strategy?
Deciding where to place plants, warehouses, and distribution centers so you can serve customers effectively, manage freight cost, and mitigate risk, linking site selection directly to network performance.
How does logistics affect manufacturing site selection?
Through transportation costs, port and rail access, supplier and customer proximity, and availability of logistics infrastructure such as intermodal facilities, inland ports, and FTZs. These shape both total operating cost and service capability.
How do transportation costs affect plant location?
They determine where a plant should sit relative to suppliers and customers. Choosing a site without analyzing inbound and outbound freight commonly produces higher long-term operating cost and longer lead times than the site comparison suggested.
Why is supplier proximity important?
It reduces lead times, lowers freight cost, and decreases required safety stock, while improving collaboration and responsiveness. It matters most in just-in-time and high-mix environments.
How do manufacturers choose warehouse locations?
By analyzing customer demand patterns, transportation costs, service-level requirements, and labor and real estate conditions across candidate regions, integrated with plant and supplier locations rather than evaluated separately.
How do ports affect manufacturing?
Port access influences import and export cost, lead time, and risk exposure. Proximity to major ports or inland ports can substantially lower transportation cost for global supply chains.
Why are rail networks important for manufacturers?
Rail offers cost-effective movement for bulk and long-haul freight. Access to rail and intermodal facilities lowers transportation cost and improves resilience for heavy or high-volume shipments.
How does labor availability affect supply chains?
It affects manufacturing productivity, logistics operations, and the scalability of your network. Regions with deep, skilled labor pools and sustainable demographics better support long-term growth.
How do incentives influence supply chain decisions?
Incentives offset initial capital and operating cost but should be weighed against logistics cost, labor, and risk. A strong incentive package cannot compensate for a structurally weak supply chain location.
What are the biggest supply chain risks today?
Geopolitical instability, tariffs, natural disasters, transportation disruption, labor shortages, supplier concentration, and increasingly, constrained grid capacity in high-growth regions.
Related Resources
Supply Chain Network Design — Determining the optimal number, size, and location of plants, warehouses, and distribution centers
Distribution Center Location Strategy — Warehouse networks, regional fulfillment models, and inventory positioning
Supplier Location Analysis — Tier 1 and Tier 2 mapping, clustering opportunities, and lead time reduction
Transportation Analysis — Mode selection, lane design, and freight cost modeling across scenarios
Foreign Direct Investment — U.S. market entry for international manufacturers
Manufacturing Site Selection — The full site selection process, from criteria through final recommendation
Industrial Site Readiness — Verifying that a location can support your operation on your timeline
Get Started With Your Project Today
Every manufacturing expansion changes your supply chain, for better or worse. Before committing to a location, understand how workforce availability, transportation, utilities, operating costs, and supplier networks will affect your long-term performance.
WorldPoint helps manufacturers make confident, data-driven location decisions that strengthen supply chains and support sustainable growth. Tell us about your project and timeline, or contact us to speak directly with our team.